

Now Reading: THE PRICE THERMOMETER: May 2026 Inflation Hits 2.7% as Grocery Relief Battles Surging Utility and Transport Costs
-
01
THE PRICE THERMOMETER: May 2026 Inflation Hits 2.7% as Grocery Relief Battles Surging Utility and Transport Costs
Advertisement

THE PRICE THERMOMETER: May 2026 Inflation Hits 2.7% as Grocery Relief Battles Surging Utility and Transport Costs
Advertisement

In an economic climate where tracking the everyday cost of living has become a corporate and household priority, the Central Statistical Office (CSO) has officially released the Consumer Price Index (CPI) Report for May 2026. Functioning as the nation’s official “price thermometer,” the data compiled by the CSO under the guidance of Director of Statistics Thembinkosi Shabalala measures exactly how the prices of everyday goods and services have fluctuated against previous market milestones.
The latest macro-economic ledger reveals that the headline inflation rate for the Kingdom of Eswatini stands at 2.7%. This represents a steady annual percentage change when measured against May 2025. While the 2.7% marker is 0.7 percentage points higher than the 2.0% observed in April 2026, it reflects a cooling of 0.5 percentage points compared to the 3.2% inflation rate recorded in May 2025.
Breaking Down the Numbers: Goods vs. Services
A deeper look into the operational index reveals a clear division between the pricing of physical commodities and commercial services:
- Goods Inflation: Clocked in at 3.2%, showing that physical merchandise continues to feel the pressure of supply chain and import pricing dynamics.
- Services Inflation: Maintained a softer track at 1.9%, reflecting a more stable pricing environment for non-tangible consumer assets.
- Month-on-Month Momentum: The short-term index change between April 2026 and May 2026 grew by 0.8%, a mild stabilization compared to the 1.2% monthly leap seen from March to April.
The Macro Picture: Year-on-Year Gains and Losses
The annual movements across the country’s core consumer baskets highlight where the Swati household budget is gaining breathing room, and where it is facing severe pressure:
📉 The Relief Sectors
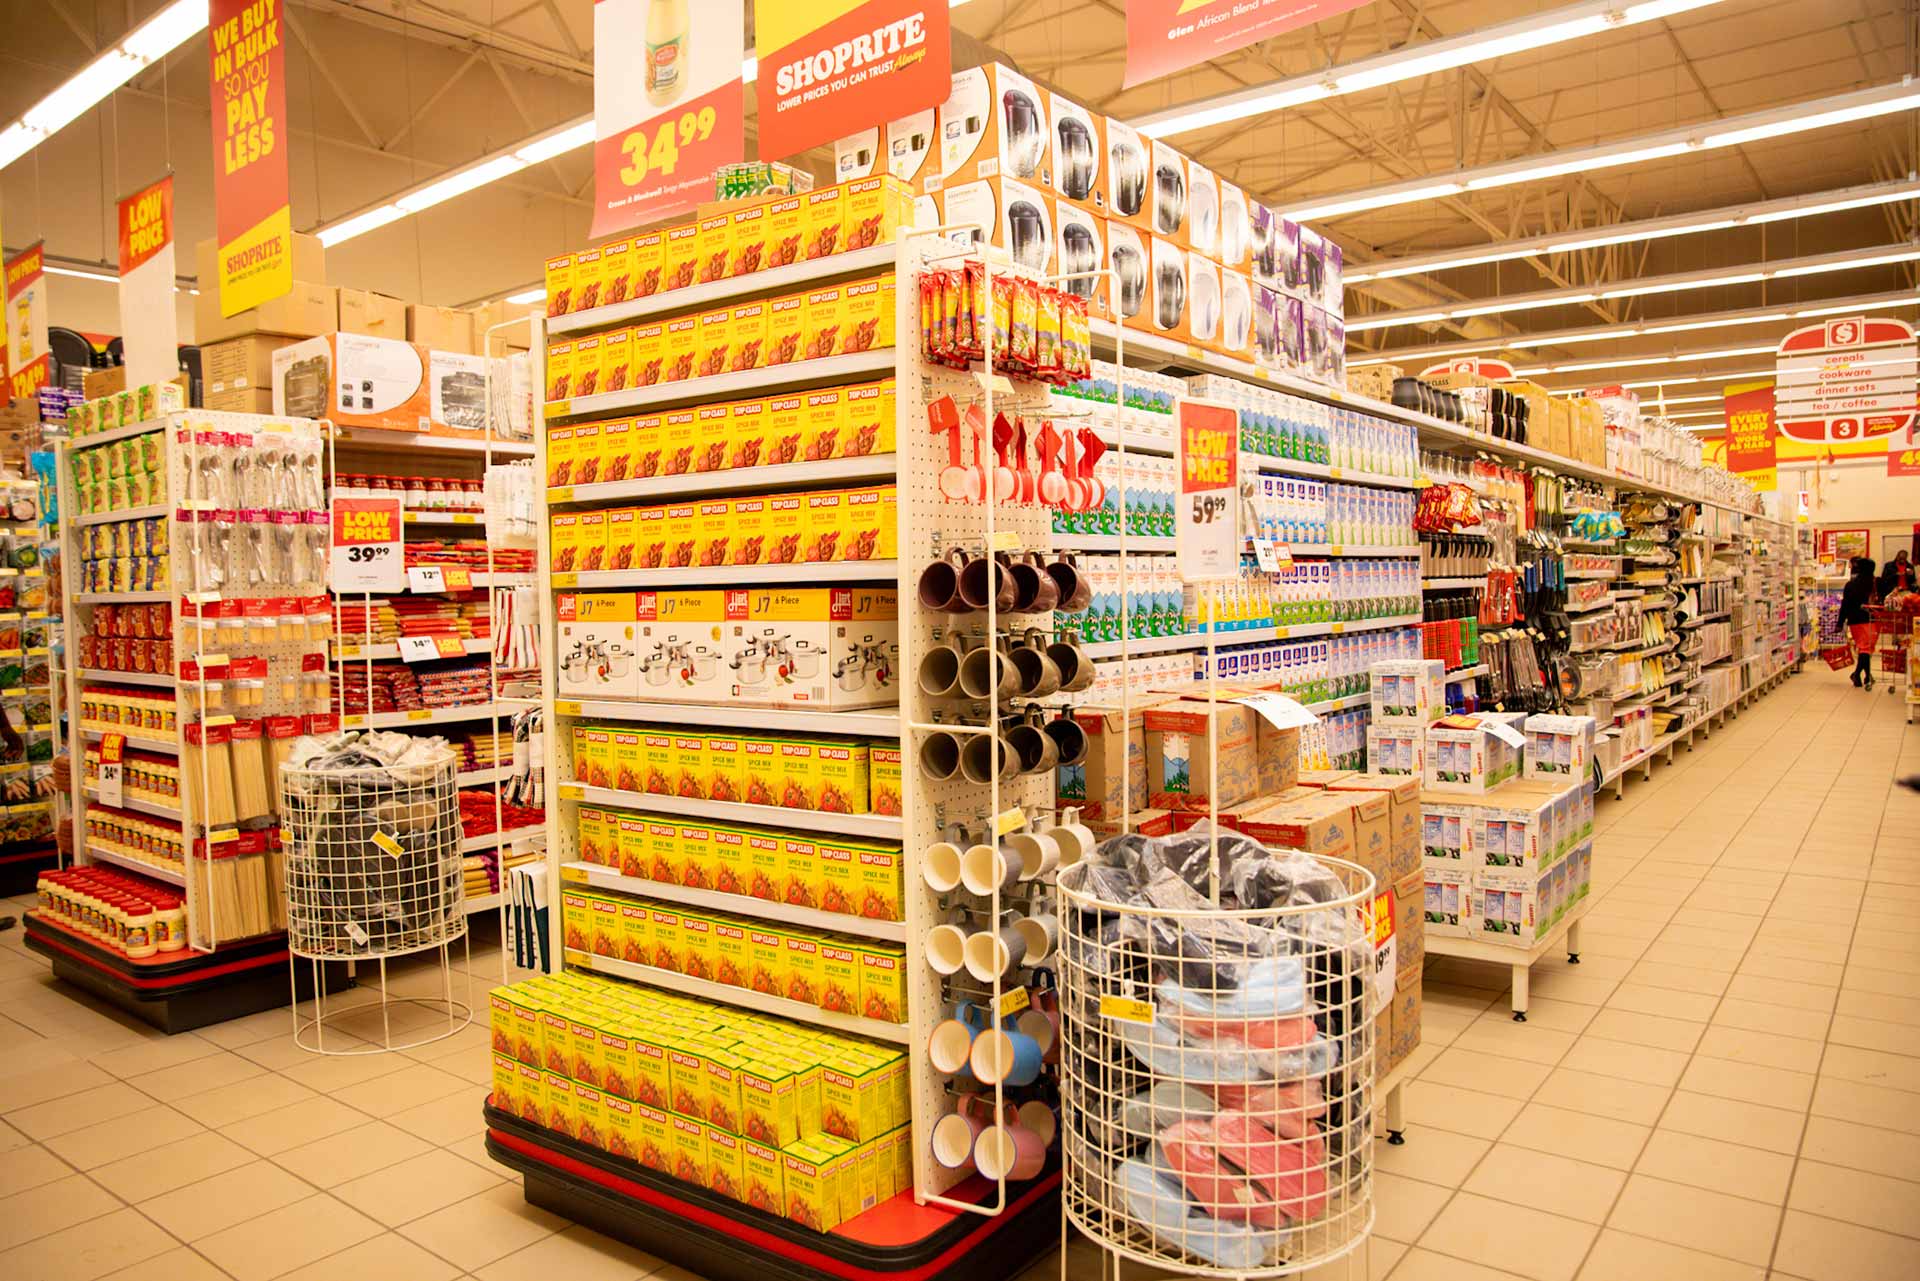
- Food & Non-Alcoholic Beverages (-1.8%): Representing a major relief for the domestic grocery bill, food costs dropped from a positive inflation rate of 3.2% in May 2025 to a negative 1.8% in May 2026. This deflationary drop was heavily driven by slower growth rates in everyday staples, including coffee, tea, cocoa, sugar, jam, honey, chocolate, and confectionery, alongside notable negative growth rates recorded for bread and cereals.
- Health (0.2%): Plummeting from a high of 4.6% in May 2025 down to just 0.2% in May 2026, driven by zero growth rates across medical services and significantly slower pricing increments for pharmaceutical products.
📈 The Inflationary Drivers
- Housing & Utilities (+6.6% Year-on-Year): Standing as the single largest contributor to the overall headline inflation rate by contributing +1.9% to the total 2.7% matrix. This massive annual jump is balanced by a month-on-month slowing down, as utility growth dropped from 3.9% in April to 1.8% in May due to zero growth rates recorded in regional electricity and water supply during the month.
- Transport (+4.0% Year-on-Year): Acting as the second largest structural contributor with a +0.7% impact on headline figures. On a month-on-month basis, transport nudged slightly upward from 2.4% to 2.5%, influenced heavily by pricing shifts in passenger transport by air.
- Clothing & Footwear (+5.8% Year-on-Year): Contributed a steady +0.3% to the overarching national inflation percentage.
- Alcohol, Tobacco & Narcotics (4.5% Year-on-Year): Though still elevated, this category experienced a sharp deceleration from the 10.7% growth rate seen in May 2025, thanks to a slower growth trend in beer and wine.
- Restaurants & Hotels (+5.9% Month-on-Month): Surged rapidly from a 1.1% growth rate in April 2026 to 5.9% in May 2026, driven directly by price movements inside local accommodation services.
📈 THE SOURCE VERDICT
THE ECONOMIC ANALYSIS: The May 2026 CPI figures give us a snapshot of an economy experiencing “split-screen inflation.” On one side, structural relief in food (-1.8%) and health (0.2%) directly protects the disposable income of lower-income families. On the other side, non-negotiable fixed overheads like housing, utilities (+6.6%), and transport (+4.0%) are actively eating into corporate operating margins and middle-class savings.
THE VERDICT: For corporate managers and retail strategists, this data is an essential compass. The spike in restaurant and hotel costs (+5.9% monthly) combined with utility demands means domestic hospitality and operational overheads are growing more expensive. However, the drop in food staples offers retail hypermarkets an opportunity to optimize volume-driven consumer promotions. Government planners tracking national salary adjustments and budget forecasting must pay close attention to this 2.7% baseline to preserve real purchasing power across the Kingdom.
🔗 THE OFFICIAL DATA ARCHIVE
To access, download, and review the full structural methodology, index weights, and detailed regional classifications from the official Central Statistical Office report, click the direct link below:
👉 Download the Official Eswatini May 2026 Inflation Report PDF
🔔 JOIN THE EXECUTIVE CIRCLE
Never guess where consumer spending, retail costs, or macroeconomic trends are heading.
Click the BLUE SUBSCRIBE ICON at the bottom of your screen to join 60,000+ top executives, retailers, and entrepreneurs who rely on The Source for instant corporate metrics, verified national data, and strategic financial analysis.
🔵 CLICK TO SUBSCRIBE & ENABLE NOTIFICATIONS


Advertisement

Stay Informed With the Latest & Most Important News


Advertisement